A Pricing Page Predicament
 Gregg Blanchard /
One of the unique things we do with SendView is that nobody can just come and sign up for the product on our sales page. Instead, they can get on the waiting list.
Letting in users in batches is a great way to make sure new features are running smoothly before new customers get their first impression of the app, to build out our list for future feature announcements, and just give us a chance to engage with and learn from folks one-on-one as we continue to work toward product market fit.
But because everyone that arrives on our pricing page has been interested enough to give us their email address, it also gives us a really consistent, qualified stream of traffic to our pricing page to analyze.
The Change
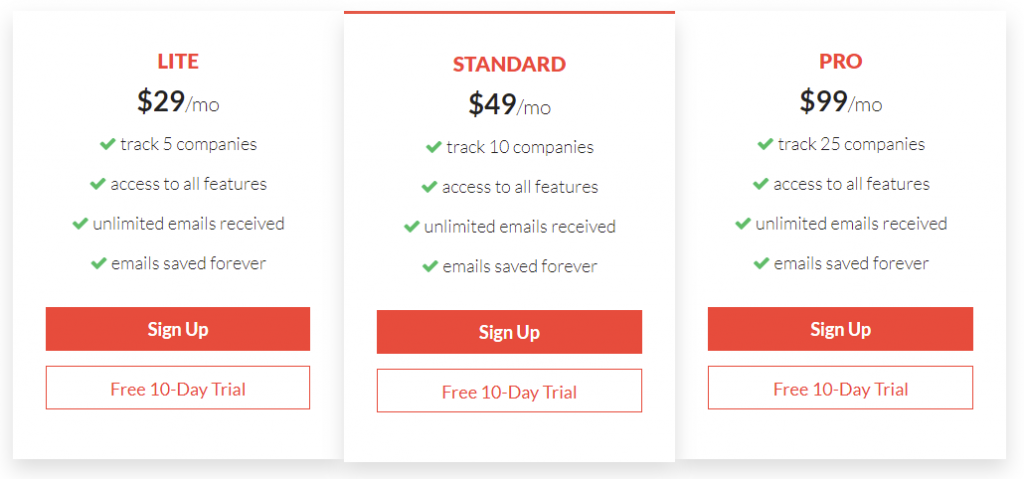
For a while we’d been rolling along with this pricing page.
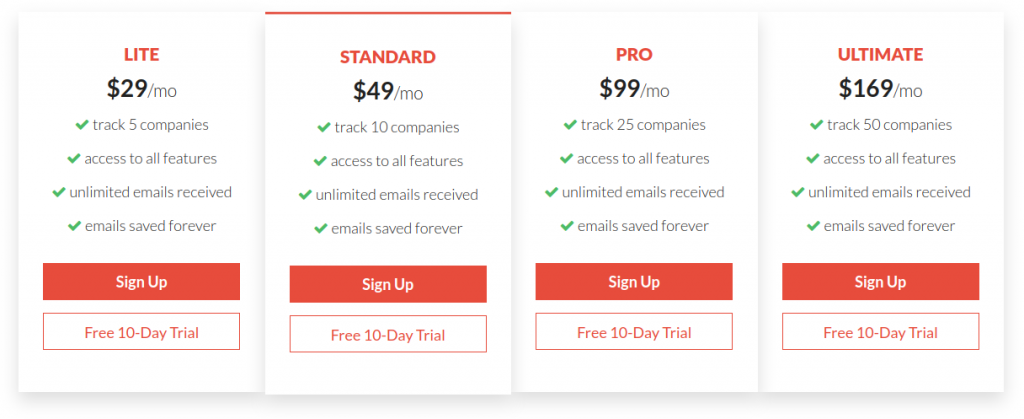
But we’d started to get more and more $99/mo users. So, late in the evening on February 20, we decided to add a larger tier at $169/mo to the table.
It was a busy stretch at the day job, but then a few weeks later I found myself asking:
Is it just me, or are signups down quite a bit lately? I feel like we’ve had a good group on the waiting list, but seems it should have translated to more paying users.
There are three numbers I measure in my conversion funnel:
- Visitors: how many people on the waiting list click through to the pricing page when they receive the email to join.
- Sign Up Clickers: how many people then click on the “sign up” or “free 10-day trial” buttons on the pricing page.
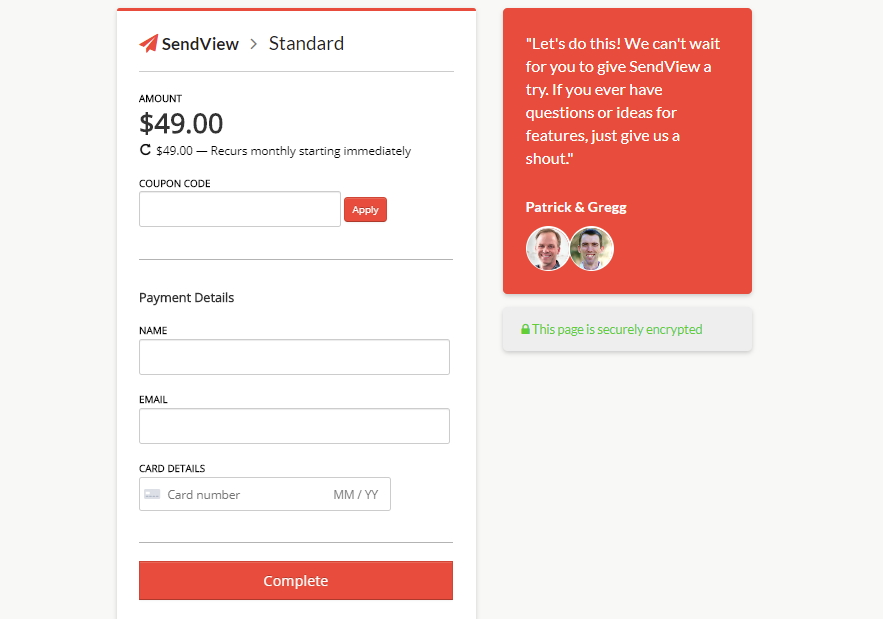
- Paying Users: how many people then enter their credit card and sign up (it’s a one-page signup).
The only things we’d changed was the pricing table, so I pulled the numbers and did the math.
Before
The three weeks leading up to February 20 went as follows:
- Pricing Page Visitors: 28
- Sign Up Clickers: 10 (35.7%)
- Paying Users: 5 (50.0%)
After
Then I pulled the numbers for the first three weeks (Feb 21 – Mar 12) using the new pricing table.
- Pricing Page Visitors: 38
- Sign Up Clickers: 7 (18.4%)
- Paying Users: 1 (14.3%)
We’d had 35% more visitors to our pricing page, but our sign up clicker rate was 1/2 of what it had been before, and the number of clickers that became paying users was 1/3 of what it was before.
What’s Up?
I am honestly not sure, but here are our four theories.
Coronavirus – Late February was when COVID-19 become a bit more of a thing in the U.S. (where almost all of our users come from). But if they were gunshy about buying new software, you’d think that would also show up in how many people show interest by getting on the waiting list and how many people then show interest by clicking to the pricing page. Yet, both of those numbers were up.
Demographics – We won an award as a top tool for product managers during this stretch, which could have skewed things. Perhaps product managers didn’t get it like an email marketer would? But, again those people would have had to be interested enough to join the waiting list and then still interested enough to click through once they got their invite.
Perception – The other thought that nags at me is that once that fourth option is on there, three things might happen:
- The user now has to choose between one more option, and perhaps that leads so some incremental percentage of paralysis.
- Our smaller plans – where most of our users fall – now look less valuable in comparison. If you put $1, $2, and $5 bill on the table, $1 and $2 still look like a lot. But place a $10 or a $20 into the mix, and now $1 looks less exciting in comparison.
- We start to look more like enterprise software and less like software for individual email marketers which, again, describes most of our users.
A Fluke – We are a small app with small numbers, so there’s a chance this is just a fluke. But before we get another influx traffic from some product launches, I wanted to put this out there in case anyone had seen something similar or had a larger data set that contradicted what we’re seeing since, given our volume, it can take months for us to feel confident in our results.
If you have any ideas or insights or feedback, I’d love to hear.